Attrition Rate Vs Turnover Rate An Essential HR Guide
The simplest way to think about the difference is this: attrition happens when an employee leaves and you don't hire a replacement. In contrast, turnover is when someone leaves and you do hire someone to fill their spot.
One signals a planned reduction in your workforce, while the other points to a revolving door of talent.
Attrition And Turnover: What HR Leaders Really Need To Know
To get a real handle on employee retention, you have to get this distinction right. Mixing up attrition and turnover is a common mistake that can lead to bad analysis, misleading reports for leadership, and ultimately, trying to solve the wrong problems. While both track people leaving the company, they tell completely different stories about the health of your organization.
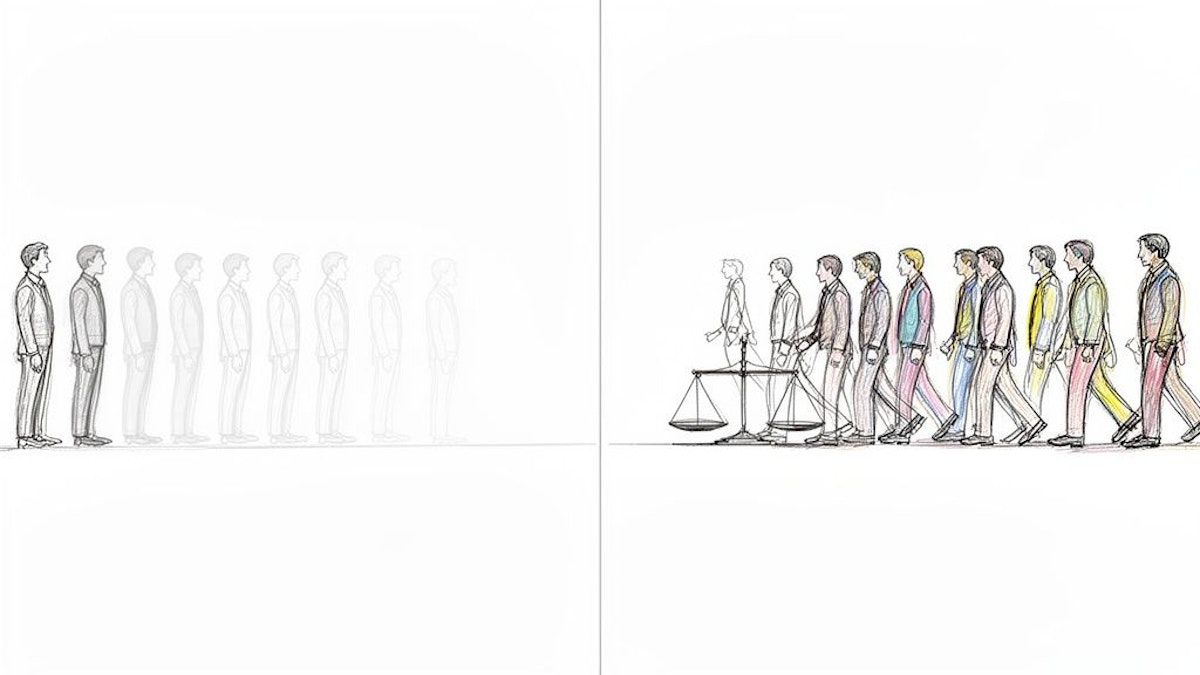
This visual gives a great breakdown of the core difference. Attrition is about the role itself disappearing, whereas turnover is about a new person stepping into an existing role.

The main takeaway here is that attrition is about reducing your total headcount. Turnover is about replacing talent.
The Core Concepts Explained
Attrition represents a permanent reduction in your team's size. It happens when someone leaves—whether through retirement, resignation, or their role being eliminated—and the company intentionally decides not to fill that vacancy. This is often a deliberate part of a larger strategy, like downsizing, restructuring, or boosting efficiency with new technology.
Turnover, on the other hand, is the complete cycle of an employee departing and a new hire taking their place. This metric includes both voluntary departures (people quitting) and involuntary departures (firings or layoffs) as long as the plan is to backfill the position. A high turnover rate is almost always a red flag for deeper issues that need to be addressed.
Attrition data is your guide for long-term workforce planning and strategic resizing. Turnover data is your real-time health check on things like management quality, pay competitiveness, and company culture.
This quick comparison table breaks down the fundamental differences between the two.
Attrition vs Turnover: A Quick Comparison
| Attribute | Attrition Rate | Turnover Rate |
|---|---|---|
| Backfill Intent | Position is eliminated; no replacement is hired. | Position is refilled after the employee's departure. |
| Strategic Focus | Measures long-term workforce reduction and restructuring. | Measures the rate of employee replacement and churn. |
| Common Causes | Retirements, automation, strategic downsizing. | Poor management, toxic culture, compensation gaps. |
| Typical Impact | Can be a neutral or positive sign of efficiency. | Almost always a negative sign of costly internal issues. |
Getting these definitions straight is critical for accurate reporting and making sense of industry data. For instance, a 2024 analysis by the Society for Human Resource Management (SHRM) found that the average annual turnover rate in the U.S. was 18%. However, this figure can vary dramatically by industry, highlighting the need for specific benchmarks.
Understanding the broader labor market context is also key. According to the U.S. Bureau of Labor Statistics, quits rates, a key component of voluntary turnover, have remained historically high in recent years, signaling ongoing shifts in worker expectations. These metrics are heavily influenced by where an employee is in their journey with the company, from onboarding to exit, which you can learn more about in the employee life cycle.
Calculating Attrition and Turnover Rates with Confidence
To get a real handle on your workforce dynamics, you need to move beyond simply tracking headcount and start calculating attrition and turnover rates accurately. Think of these metrics as the first step in turning raw HR data into a strategic asset. While the terms get confused all the time, their formulas are actually quite similar. The trick is knowing which employees to count.
First, you’ll always need to find your average employee count for a specific period (usually a quarter or a year). From there, the key difference boils down to one simple question: Was the person who left replaced?

This distinction—separations that are backfilled versus those that are not—is everything. It shapes which numbers go into your formula and ultimately determines the story your data tells.
The Core Formulas for Attrition and Turnover
Calculating these rates is pretty straightforward once you have a few key numbers: your employee count at the start and end of the period, and the total number of people who left.
Here are the standard formulas:
Attrition Rate Formula: This one focuses exclusively on roles that were not refilled after an employee left.
(Number of Unreplaced Separations / Average Employee Count) x 100Turnover Rate Formula: This is the broader measure. It includes all separations—both voluntary and involuntary—for positions the company plans to fill again.
(Total Separations / Average Employee Count) x 100
One of the most common mistakes is not having a consistent way to classify departures. Your data is only as good as its source, so make sure your HRIS has a clear process for tagging every separation as "replaced" or "unreplaced." Otherwise, your calculations won't be reliable.
Calculation in Action: A Real-World Scenario
Let's walk through an example. Imagine a company with 250 employees, and we want to see what happened in the first quarter (Q1).
Company Data for Q1:
- Employees on January 1: 250
- Employees on March 31: 244
- Total separations during Q1: 10
- Separations not being replaced (due to retirements or eliminated roles): 4
First things first, we need the average employee count for the quarter: (250 + 244) / 2 = 247
Now that we have our average headcount, we can plug it into the formulas.
1. Attrition Rate Calculation
We know that 4 of the separations were for roles that won't be refilled. So, the attrition rate is: (4 Unreplaced Separations / 247 Average Employees) x 100 = 1.62%
This 1.62% attrition rate tells a specific story: the company is shrinking slightly due to planned workforce changes and natural departures.
2. Turnover Rate Calculation
For turnover, we count all 10 separations because we’re measuring the overall churn of roles that need backfilling. (10 Total Separations / 247 Average Employees) x 100 = 4.05%
A 4.05% turnover rate signals a different kind of issue. It’s the "revolving door" metric, and it often points to problems with culture, management, or compensation that need a closer look. If you want to dive deeper, our blog has a complete guide on how to calculate employee turnover rate with more detailed breakdowns.
By tracking both, the company gets a much clearer picture. They see a small, strategic reduction in headcount (attrition) alongside a more concerning level of overall churn (turnover) that requires action. This dual-metric approach is what allows HR to provide truly nuanced and actionable insights to leadership.
Analyzing The Causes And Costs Of Each Metric
Knowing how to calculate attrition and turnover is just the starting point. To really use these metrics effectively, you need to dig into the unique causes behind each one and understand the specific costs they bring to your business. While both track employees leaving, their root causes and financial fallout are worlds apart.

Getting the why behind attrition versus turnover straight is crucial. Attrition usually happens because of strategic or natural shifts in the workforce. Turnover, on the other hand, almost always flags solvable problems inside the company. Making this distinction helps you diagnose the health of your organization with much greater accuracy.
The Underlying Drivers of Attrition
Attrition is typically the result of factors that lead to a role being permanently removed. Think of it as a measure of planned or predictable workforce reduction, not a red flag for widespread employee dissatisfaction.
Common reasons for attrition include:
- Retirements: A long-time employee reaches the end of their career, and the business decides their role can be absorbed by others or is simply no longer needed.
- Organizational Restructuring: The company shuffles departments or business units to become more efficient, which can lead to consolidating or eliminating certain positions.
- Automation and Technology: New software or machinery makes a job function obsolete, and the role gets phased out.
- Project Completion: A major project wraps up, meaning the temporary or project-specific roles tied to it are no longer necessary.
In these situations, a rising attrition rate can be a neutral, or even positive, sign. It might mean a strategic downsizing is proceeding as planned or that the company is successfully finding new efficiencies. The key is that these departures are expected and managed as part of a bigger business strategy.
Unpacking The Causes Behind Turnover
Turnover, in contrast, is all about churn. It tracks employees who leave roles that the company then has to scramble to refill, signaling an unplanned and often disruptive talent loss. The causes are almost always tied directly to the employee experience.
Research consistently shows that most turnover is preventable. A landmark study by Gallup found that 52% of voluntarily exiting employees say their manager or organization could have done something to prevent them from leaving. The top reasons they cite include lack of career advancement opportunities, poor compensation, and a lack of role fit. This data makes it crystal clear: voluntary turnover often stems from internal problems you can fix.
Attrition reflects a change in the structure of the organization. Turnover reflects a problem with the health of the organization.
The most common culprits behind high turnover include:
- Ineffective or toxic management
- Lack of career growth opportunities
- Uncompetitive pay and benefits
- Poor work-life balance and burnout
- A weak or misaligned company culture
Comparing The Business Impact And Costs
The financial and operational hits from attrition and turnover couldn't be more different. Attrition's costs are generally limited and predictable. Turnover, however, unleashes a flood of direct and indirect expenses that can seriously harm a company's bottom line.
The Cost of Attrition: The main cost tied to attrition is the loss of institutional knowledge, especially when a seasoned employee retires. But because you aren't replacing the role, the company dodges the hefty expenses of recruiting and onboarding. In many cases, the salary savings from the eliminated position more than make up for any temporary dips in productivity.
The Cost of Turnover: Turnover is a different beast entirely—it’s incredibly expensive. Research from SHRM suggests that replacing a single employee can cost anywhere from 50% to 200% of their annual salary. That figure accounts for a wide range of expenses that pile up fast.
Here’s a quick breakdown of where that money goes:
Recruitment Expenses: This covers everything from job board ads and agency fees to the hours your HR team and hiring managers pour into screening and interviewing. When tallying the cost of turnover, a major factor is the investment needed to find a replacement, often broken down as the recruitment cost per hire.
Onboarding and Training Costs: You spend significant time and money getting a new hire up to speed, from formal training sessions to the informal mentoring they receive from managers and coworkers.
Lost Productivity: A new employee doesn’t hit the ground running at full speed. It takes time—sometimes a year or more—for them to match the performance of the person they replaced. Productivity inevitably suffers during this ramp-up period.
Decreased Morale: High turnover can create a feeling of instability. Remaining employees may get overworked, become disengaged, and start looking for the exit themselves.
Understanding these steep costs is vital for building a business case to invest in retention. For a more detailed look, check out our guide on how to run a cost of turnover calculation. By clearly separating your attrition rate vs turnover rate, you can focus your resources on fixing the expensive, preventable problem of unwanted employee churn.
Applying The Right Metric For Strategic Decisions
Knowing the textbook definitions of attrition and turnover is one thing. But the real magic happens when you know which metric to pull out of your toolkit for a specific business challenge. These two numbers tell very different stories about your workforce, and using the right one at the right time is how you shift from putting out fires to building a truly proactive talent strategy.
Think of it this way: attrition gives you the long-range forecast, while turnover is your real-time weather report on organizational health. Choosing the right lens helps you focus your time, energy, and resources where they’ll make the biggest difference.
When To Use Attrition Rate For Long-Term Planning
Your attrition rate is your crystal ball for long-range workforce management. Because it only tracks roles you don't intend to refill, it’s a direct reflection of deliberate, strategic shifts in your company's size and structure. It’s less about diagnosing immediate pain points and more about future-proofing your talent pipeline.
Focus on your attrition rate when you need to:
- Manage Succession and Knowledge Transfer: Imagine a manufacturing firm tracking quarterly attrition. They can see a wave of retirements coming and get ahead of it, creating mentorship programs to transfer decades of know-how before it walks out the door.
- Guide Strategic Workforce Planning: If your five-year plan involves automating certain functions, your attrition rate helps you model how your headcount will naturally shrink. This allows for a gradual, managed reduction through non-replacement instead of resorting to disruptive layoffs.
- Project Future Talent Gaps: By analyzing attrition trends, you can foresee which departments or skill sets are dwindling. This is critical for planning future recruitment campaigns or launching internal upskilling programs to fill the voids you know are coming.
Attrition is fundamentally a strategic metric. It helps you answer the question, "Where is our workforce headed, and are we prepared for that future?" It’s about looking through the telescope, not the microscope.
When To Use Turnover Rate To Diagnose Immediate Issues
Turnover rate, on the other hand, is your first-response diagnostic tool. It’s the metric you use to check the immediate health of your company culture and day-to-day operations. Since turnover captures all roles that need to be backfilled, a high rate is almost always a flashing red light signaling a costly, urgent problem that needs your attention now.
Turn to your turnover rate to:
- Evaluate Manager Effectiveness: A high turnover rate isolated to one specific team is often a direct signal of a leadership problem. A SaaS company that sees monthly turnover spiking on its sales team can quickly investigate for signs of burnout or poor management and step in before losing more top performers.
- Measure Onboarding and Early Engagement: Are new hires heading for the exit within their first year? Your turnover data is screaming that your onboarding is broken or that the job reality doesn't match the promises. This gives you a clear mandate to fix your Day 1 experience.
- Assess Company Culture and Compensation: When you see a spike in voluntary turnover across the entire organization, it’s a massive warning sign. This points to widespread issues with pay, work-life balance, or a toxic environment that demands immediate investigation.
Data from the U.S. Bureau of Labor Statistics puts these separations into perspective. Recent reports, for example, showed 3.5 million total "quits" in a single month against 1.5 million layoffs and discharges—a clear sign that voluntary turnover remains a powerful force in the labor market. Diving into the full BLS Job Openings and Labor Turnover Survey can help you see the bigger picture. When you compare your numbers to industry benchmarks, like the high quits rate in accommodation and food services versus the much lower rate in federal government, your own data becomes much more meaningful.
Building a Culture That Keeps Your Best People
Knowing the difference between attrition and turnover is the first step. But let's be honest—measurement alone doesn't stop people from walking out the door. The real work begins when you use that data to tackle the root causes of preventable turnover, the expensive kind that signals deeper problems within your organization.
A huge driver of these "regrettable" departures is a simple mismatch between an employee's values and the company's culture. When what matters to a person doesn't align with how the business actually operates, disengagement is almost a guarantee. This is where you have to move beyond guesswork and start making data-backed decisions to build a more resilient team.
Moving Beyond Gut Feel in Hiring
Traditional hiring often leans too heavily on subjective interviews and that vague "gut feeling," which can easily miss critical misalignments in work styles or core values. A science-backed culture assessment platform like MyCulture.ai completely changes this dynamic. It gives you the tools to look past a candidate's resume and see how they truly align with the behaviors and values that predict long-term success at your company.
By using customizable assessments, you can pinpoint candidates who are a natural fit for your unique cultural DNA. This data-driven approach allows you to:
- Identify candidates whose work styles mesh with your team's day-to-day rhythm.
- Verify that an applicant's core values line up with your company's mission.
- Predict a new hire's potential for genuine, long-term engagement.
This process shifts hiring from a high-stakes gamble to a strategic decision, directly addressing the "lack of role fit" and "career misalignment" that research from organizations like Gallup consistently shows as top reasons for voluntary turnover.
Using Data to Spot and Solve Problems
Once someone is hired, the challenge pivots to keeping them. MyCulture.ai supports this next phase with clear, visual reports that help managers instantly spot potential areas of friction. These insights aren't just for making the hire; they become a practical roadmap for effective onboarding and day-to-day management.
For example, imagine an assessment shows a new hire thrives on autonomy, but they're joining a team with a very hands-on manager. That potential "red flag" is actually an immediate coaching opportunity. The manager can proactively adjust their style to give that employee the space they need, preventing the kind of friction that so often leads to a preventable departure within the first year.
The goal isn't just to hire people who fit your culture, but to equip your managers with the insights needed to nurture that fit over time. Data empowers managers to be proactive, not reactive, in building engaged and committed teams.
This targeted approach helps you fix the specific issues that cause good employees to leave. Instead of rolling out generic retention programs and hoping for the best, you can focus your efforts where they'll make a real difference. For more ideas, explore these practical employee retention strategies that can amplify your efforts.
Actively Reducing Turnover with Targeted Tools
Beyond identifying misalignments, the best way to lower turnover is to tackle its main causes head-on—things like poor engagement and a fuzzy career path. MyCulture.ai directly supports this with a suite of AI-powered tools designed to help managers become better leaders.
These tools are built to solve the everyday problems that slowly chip away at employee morale and eventually drive them to look for opportunities elsewhere.
The table below shows how you can connect common turnover drivers to concrete solutions, giving you a clear path toward better retention.
Mitigating Turnover With Proactive Strategies
| Common Turnover Driver | MyCulture.ai Solution | Resulting Business Outcome |
|---|---|---|
| Lack of Clear Expectations | AI-Generated 30/60/90-Day Plans | New hires feel supported and productive from day one, reducing early-stage turnover. |
| No Visible Career Path | OKR & Career Tracker Templates | Employees see a clear future at the company, increasing motivation and long-term loyalty. |
| Poor Manager Support | Performance Improvement Plan Guides | Managers are equipped to handle performance issues constructively, salvaging relationships. |
| Role Ambiguity | AI-Powered Role Definition Generator | Every team member understands their responsibilities, reducing confusion and frustration. |
By integrating these tools, you're no longer just measuring turnover—you're actively preventing it. Managers aren't left on their own to figure out how to engage their teams; they get a practical toolkit to foster growth, provide clarity, and build a culture where top performers actually want to stay. This creates a powerful cycle where data-driven hiring and intentional management work hand-in-hand to build a truly retention-focused organization.
Your Top Questions About Attrition and Turnover, Answered
Knowing the difference between attrition and turnover is the first step. But as any HR pro knows, applying these metrics in the real world brings up a whole new set of questions. Let's tackle some of the most common ones I hear.

Getting these details right helps you sharpen your strategic focus and build a healthier, more stable company.
Is a High Attrition Rate Always a Bad Thing?
Not always. While a high attrition rate should definitely make you pause and investigate, it isn't automatically a red flag. Sometimes, it's the result of a deliberate, strategic decision.
For instance, a high rate could be the planned outcome of a successful restructuring, where certain roles were eliminated to make the organization more efficient. It might also reflect a wave of retirements in an older company, which, if you have a solid succession plan, is just a natural part of the business cycle. The key is to understand the story behind the number. High attrition only becomes a problem when it's unplanned and you're losing critical skills or knowledge with no plan to replace them.
How Can I Segment Turnover Data to Get Better Insights?
Raw turnover data is just noise. To get real, actionable intelligence, you have to break it down. The most important split you can make is between voluntary turnover (people choosing to leave) and involuntary turnover (people being asked to leave, like through terminations or layoffs).
Your HRIS should let you categorize every departure. By running separate reports for each type, you can diagnose problems with incredible precision.
High voluntary turnover is often a symptom of deeper issues—a toxic culture, non-competitive pay, or poor management. High involuntary turnover, on the other hand, might point to a broken hiring process or a performance management system that isn’t working.
This simple act of segmentation shifts your focus from a vague question like, "Why are people leaving?" to a much more solvable problem like, "Why are our best people resigning?"
What’s a "Good" Turnover Rate for My Industry?
This is a tricky one because there’s no magic number. A "good" turnover rate depends entirely on your industry, the specific roles, and even your location. For a government agency, a 10% turnover rate could be fantastic. For a specialized software company, it might be a five-alarm fire.
The hospitality and retail industries, for example, naturally have much higher turnover than sectors like finance or education. To get a realistic baseline, you need to look at data from credible sources like the U.S. Bureau of Labor Statistics or other industry-specific reports.
Your ultimate goal shouldn't be to just hit some arbitrary percentage. Instead, focus on achieving a steady, downward trend in your regrettable voluntary turnover. Seeing that specific number decrease over time is one of the strongest signs that your company's health is improving and you're building a culture where people truly want to work.
Ready to stop just tracking departures and start building a culture that makes your best people want to stay? MyCulture.ai gives you the science-backed tools to hire for genuine value alignment and help your managers create real engagement. Start building your retention-focused culture today.